Report making is one of the daily activities for most of the garment manufacturers in the garment industry. Most of them use a spreadsheet (MS Excel or Open Office) for making a
daily production report and other reports.
I assume that you are one of them. You may know how to use a spreadsheet. The question is how are you utilizing excel tools to make your reports?
Take an example of making Daily production report (DPR). You make it daily, right? How do you do it? I hope you follow this step,
Existing Method of Report Making
- You have DPR template with set formula
- You copy last day’s sheet and make new sheet.
- You delete previous day’s production quantity and add today’s production
- Add new rows in the template if need to add more/new style in the report
- You drag the formula to new rows added in the new sheet
- You calculate total production by adding today’s production
- You cross-check and tally production quantity with previous reports and actual report twice.
(If you already made 31 sheets date wise in a file you also need to similar activities)
Finally, you get the DPR but this is only one report with lot of rows and column. You spend lot of time and energy but the final outcome is a clumsy report. If one takes printout of the DPR having more than four sewing lines it is really a torture to the report reader. Are you happy with such report format? (See Figure 1)
 |
| Figure -1: Daily Production Report |
If you are asked to make summarized report (e.g. style wise summary report, day-wise production day of a style, or monthly report) or report in a different format, it would be a tough job (time consuming job). In case management asks for report I know this job is more than a mental torture.
Other disadvantages are
- You need enter same data in multiple sheets/multiple reports
- You need to make separate file for each month.
- You need make multiple reports as requested by management
- Limited form of reporting
How can you improve your reporting making process?
Use pivot table. All you need to enter data in one sheet and view report as you want. Make one sheet for data entry. Design your data entry sheet with maximum data field required to make all of your desired reports. Design your reports (to be viewed) using pivot table. You will get Pivot table in Inset tab (See Figure 2) in the menu bar.
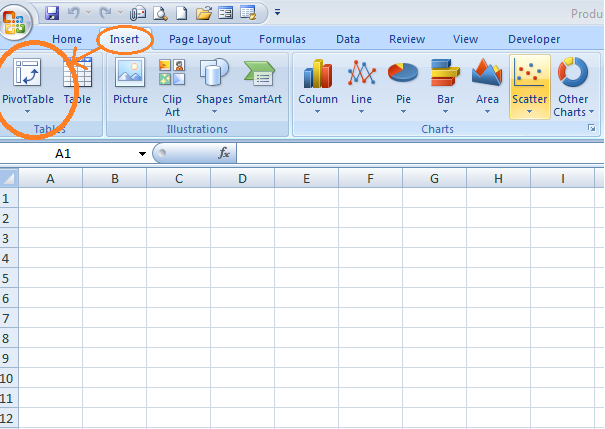 |
| Figure -2: Inserting Pivot table |
In this article I am not going to teach you how to use pivot table. You can learn it by reading online. I will show an example that I use making production report.
Making report using pivot table is not difficult. But most of us don’t know how to use Pivot table. I have learned this last year and prepared more than 100 reports for garment manufacturers using pivot table. I have shown here an example (with hypothetical data).
In this report you will get following report (See Figure 3)
- Daily production report
- WIP Report (Running styles)
- Monthly Report
- Style Summary Report
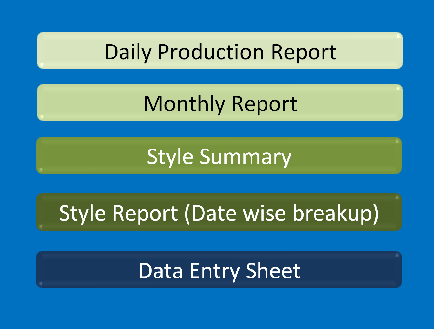 |
| Figure-3: List of Reports |
- Style report (Date wise break-up)
Benefits of using Pivot table.
In this report you
- Don’t need to make multiple files for making different reports using same data.
- Don’t need to make day wise DPR (Daily Production Report).
- Don’t need to copy the file and edit data and enter new data on the current sheet
- Don’t need to check your formula daily prior to taking the printout.
You just need to enter data in one sheet (See Figure 4). And all desired reports will be generated just by refreshing data. You can make numerous reports and check data using filter as much variation as you need provided that you have entered all related data in the entry sheet that you want to view in the report. By making multiple reports you can keep your DPR clean (See Figure 5, 6, 7). Data analysis become very easy when you keep all data in one table.
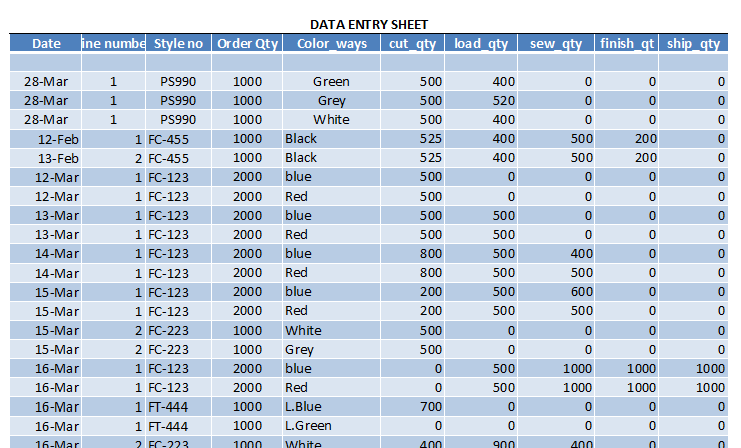 |
| Figure-4: Data Entry Sheet |
Daily Production Report: To view the daily production you need to select date only from the drop down menu. For WIP report you need select running styles.
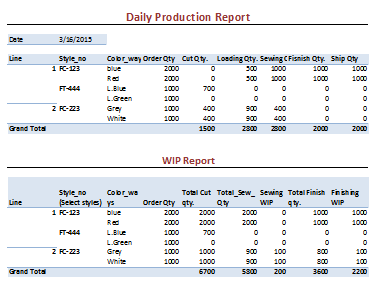 |
| Figure-5: Daily Production Report (DPR) |
Monthly Production Report: You will get monthly report by selecting Month and Year. In the sample report I have not shorted month wise.
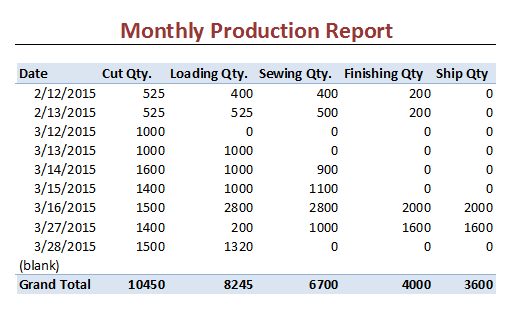 |
| Figure 5: Monthly Production Report |
Style Report: You can check detailed report for styles date wise past data (See Figure 6). Report can be viewed for single style and multiple styles.
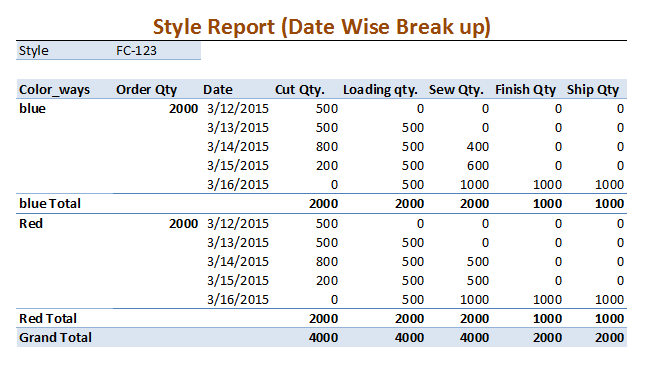 |
| Figure 6: Style Report |
Style Summary Report: You can check production status of all styles for a duration (See Figure 7).
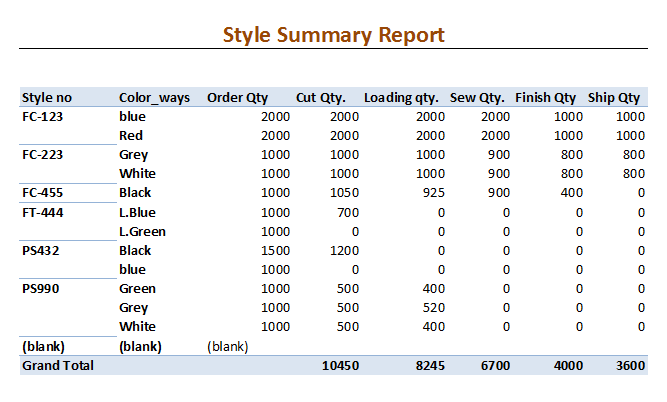 |
| Figure -7: Style Summary Report |
P.S. You can make an advanced report using SQL query and pivot table in excel.
